Learning Analytics – Thinking beyond Pie charts & Bar charts
According to the NMC Horizon Report for Higher Education, the time for main-stream adoption of Learning Analytics and Adaptive Learning is “One Year or Less”. You may think that your Learning platform is well on track, with rich dashboards and jazzy reports about student logins, time on task, student grades over time, performance across programs and what not. The truth is that most of the Learning platforms today (open-source, commercial and home-grown) have all these basic reporting and analytics capabilities. In fact, they have had it for a while. So why all this hype around “Learning Analytics”, and why is everyone making a big deal out of it now?
“Learning Analytics” is much more than a bunch of reports that depict the student experience on one single platform. Its not just about what has happened in the past, its also about what is going on right now, and what can be expected in the future. It does not end with reports and charts calling for action, it’s about turning the inferences and insights into meaningful actions, or at-least enabling users to do so.
There are a few things that clearly differentiate “Learning Analytics” from the shallow reporting offerings –
Analytics across Platforms and Experiences
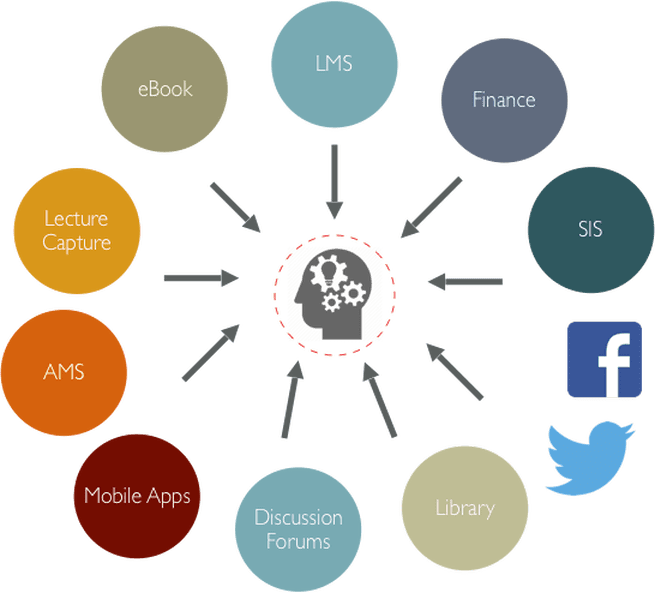
Learning does not happen on one single platform. It happens across platforms and experiences. A typical eLearning ecosystem comprises of a variety of learning platforms including Learning Management Systems, eBook platforms, Assessment platforms, Mobile applications, Discussion forums and many more. Apart from these, a significant amount of learning happens in-class, during office hours, over the social media and other “non-learning” channels.
Learners interact with these multitudes of platforms, leaving “data-trails”. While the individual platforms do a good job of capturing & reporting this data, they fail to depict the overall learning experience of the learner. True “Learning Analytics” is about gathering the experience of the learner from all the possible sources to provide a “holistic view” across platforms and experiences.
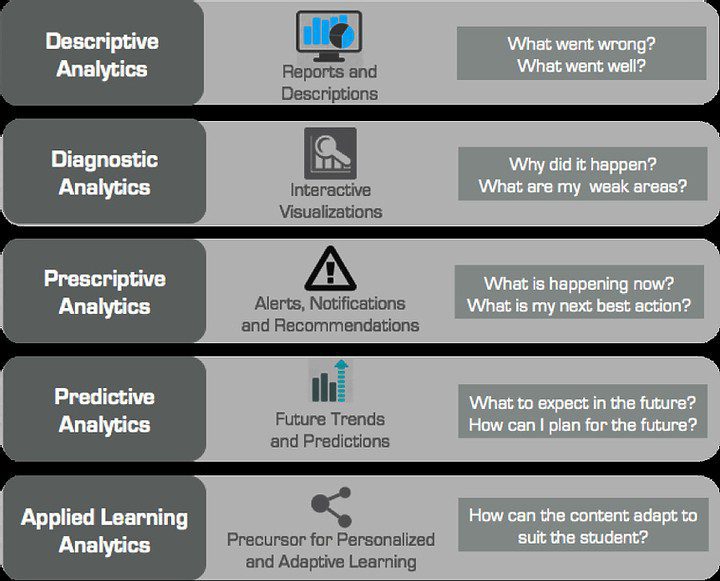
Reports and charts are good for visualizing what has already happened. They help in understanding what went well or what went wrong (Descriptive Analytics).
But Analytics can go beyond reports and charts and help us understand more about why things went wrong in the first place (Diagnostic Analytics).
It can help us understand what is happening now, what should be our next best action through alerts, notifications, recommendations, and help us be on track and never miss out on any thing important (Prescriptive Analytics).
Furthermore, based on the historical data Analytics can help us predict future trends, understand what to expect in the future and how to plan for it (Predictive Analytics).
Finally, Analytics can enable us to turn these inferences and insights into actions, by providing feedback to the platform to personalize the experience for the learner (Applied Learning Analytics).
Analytics for All
Finally, Analytics is not limited to instructors and super admins. Analytics can cater to all the stakeholders in the learning eco-system, including Learners, Instructors, Curriculum Designers, Program Admins, Content Creators, Publishers, Institution Admins and many more. As an example – Learners can see where they stand in the program, identify their weak areas, and get recommendations and nudges on how they can improve. Instructors can see the performance & progress of their class, identify at-risk students, intervene to take necessary actions, predict class performance. Program admins can monitor the health and performance of the program, compare instructors, predict enrollments. Publishers can profile their content, identify and weed out non-performing content, improve content that needs attention.
The emerging standards for capturing experience data in Learning platforms (xAPI, LRS, Caliper Frameworks etc.) have enabled fine-grain capture of learner engagement & performance data. The advances in Big-Data technologies have enabled efficient ways for storing and processing large amounts of data, to generate rich visualizations, useful insights and predictions, making true “Learning Analytics” a reality today.